


Statistical Tables Plus 5.3
وصف لـStatistical Tables Plus 5.3
Statistical Tables Plus Version 5.2
Value packed combination of Probability
Distribution Tables, plus commonly used
statistical inference tests.
Updated UI. Inference Test Formulas
added for one and two population means.
Convenient, Accurate, Easy to Read
electronic Probability Distribution Tables.
Commonly used statistical inference tests.
Confidence Interval calculation.
Normal, Binomial, Poisson, T, F and Chi-Square
Distributions. Also, invNorm and
invT calculations.
Data entry for 10 variables.
Descriptive Statistics. (Added Percentiles,
Skewness and Kurtosis).
Statistical Tests Including t-test, ANOVA,
MannWhitneyU Test, Chi-Square Test,
Simple Linear Regression.
Contains calculators for Confidence
Intervals (Sigma Known, Sigma Unknown,
Proportion), Permutations and Combinations.
Great for Intro Probability Statistics
courses, or if you just need these tables!
For both Phone and 10' tablets.
These tables give you the probabilities
associated with your test statistics and
parameters.
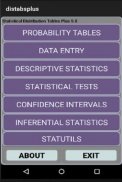
To use these tables, just select the
distribution you want, and put in the
test statistic and parameters, and the
APP tells you the related probability.
*************************************
1) For the Normal Distribution:
Enter your Z Score, and you get
the left, right tails and the range.
2) For the Binomial Distribution:
Enter n - number of trials,
p - probability of success,
x - number of successes
and you get the probability of
x, or the cumulative probability
for x.
3) For the Poisson Distribution:
Enter the mean, and number of
occurences, and you will get
the Probability of the number
of occurences, and the cumulative
probability.
4) For the t Distribution:
Enter t and the Degrees of Freedom
and you will get the probability
of the left and right tails, and
the two tailed probability.
5) For the f Distribution:
Enter the f statistic, and the
Degrees of Freedom for the numerator
and denominator. You will get the
probability for the right tail
(alpha for the ANOVA test).
6) For the Chi-Square Distribution:
Enter Chi-Square and the Degrees of Freedom
and you will get the probability
of the right tail.
7) Inverse Normal.
Enter the probability of the
Normal Distribution left tail,
and you get the Z statistic.
8) Inverse t
Enter the probability of the
t distribution left tail, along with
the degrees of freedom, and you will
get the t statistic.
Confidence Intervals:
Sigma Known. Uses the standard
CI formula (Using Z) to determine the range with
CI% chance of containing the true mean
of the population.
Sigma unKnown. Uses the standard
CI formula (Using t) to determine the range with
CI% chance of containing the true mean
of the population.
CI for a proportion. Uses the standard
CI formula (Using p,n,Z) to determine the range with
CI% chance of containing the true mean
of the population.
Statistical Utilities:
Permutations and Combinations give number
of ways to select n Items out of N Items.
In Permutations Order of selected Items matters,
in Combinations it does not. Sampling is
without replacement.
Sample size n, is number needed for CI with
following parameters:
alpha - CI between 0 and 1.0
sigma - Known standard deviation.
E - desired error.
Formula is: n = (Z^2 * s^2) / E^2
Z is Z score for (1-alpha)/2
Includes 5 common statistical tests,
and Descriptive Statistics.
Help for each test is included in
the APP.
Inferential Statistics Formulas:
Difference between 2 Population Means.
Hypothesis Test Mean.
Proportions.
Free!. Please visit this APP in
the Google Play store to Rate and
enter comments. This will help us
improve the APP over time.
Due care has been taken for accurate results.
This APP is for educational use.
However, no warrenty against any damages due to
use is included or implied.
الجداول الإحصائية زائد الإصدار 5.2
قيمة معبأة مزيج من الاحتمالات
جداول التوزيع ، بالإضافة إلى استخدام شائع
اختبارات الاستدلال الإحصائي.
تحديث واجهة المستخدم. صيغ اختبار الاستدلال
وأضاف لواحد واثنين من السكان يعني.
مريحة ودقيقة وسهلة القراءة
جداول التوزيع الاحتمالي الإلكتروني.
يشيع استخدام اختبارات الاستدلال الإحصائي.
حساب الثقة الفاصل.
عادي ، ذو حدين ، Poisson ، T ، F و Chi-Square
التوزيعات. أيضا ، invNorm و
حسابات invT.
إدخال البيانات لمدة 10 المتغيرات.
الإحصاء الوصفي. (أضيفت النسب المئوية ،
الانحراف والتقرح).
الاختبارات الإحصائية بما في ذلك اختبار t ، ANOVA ،
اختبار MannWhitneyU ، اختبار Chi-Square ،
الانحدار الخطي البسيط.
يحتوي على الآلات الحاسبة للثقة
فترات (سيغما معروف ، سيغما غير معروف ،
نسبة) ، التباديل والتوليفات.
كبيرة لإحصائيات احتمالات مقدمة
الدورات ، أو إذا كنت تحتاج فقط هذه الجداول!
لكل من الهاتف و 10 'أقراص.
هذه الجداول تعطيك الاحتمالات
المرتبطة إحصائيات الاختبار و
المعلمات.
لاستخدام هذه الجداول ، ما عليك سوى اختيار
التوزيع الذي تريده ، ووضعه في
اختبار الإحصاء والمعلمات ، و
يخبرك التطبيق الاحتمال ذات الصلة.
*************************************
1) للتوزيع الطبيعي:
أدخل نقاط Z الخاص بك ، وتحصل
ذيول اليسار واليمين والنطاق.
2) للتوزيع ذي الحدين:
أدخل n - عدد التجارب ،
ع - احتمال النجاح ،
س - عدد النجاحات
وتحصل على احتمال
س ، أو الاحتمال التراكمي
ل x.
3) لتوزيع بواسون:
أدخل الوسط ، وعدد
الحوادث ، وسوف تحصل
احتمالية العدد
من الحوادث ، والتراكمية
احتمالا.
4) للتوزيع t:
أدخل ر ودرجات الحرية
وسوف تحصل على الاحتمال
من ذيول اليسار واليمين ، و
احتمال الذيل اثنين.
5) للتوزيع f:
أدخل الإحصاء f ، و
درجات الحرية للبسط
والمقام. سوف تحصل على
احتمال الذيل الأيمن
(ألفا لاختبار ANOVA).
6) لتوزيع تشي سكوير:
أدخل ساحة تشي ودرجات الحرية
وسوف تحصل على الاحتمال
من الذيل الأيمن.
7) معكوس عادي.
أدخل احتمال
التوزيع الطبيعي الذيل الأيسر ،
وتحصل على إحصاء Z.
8) معكوس ر
أدخل احتمال
ر توزيع ذيل اليسار ، جنبا إلى جنب مع
درجات الحرية ، وسوف
الحصول على الإحصاء ر.
فترات الثقة:
سيغما المعروفة. يستخدم المعيار
صيغة CI (باستخدام Z) لتحديد النطاق مع
CI ٪ فرصة لاحتواء المتوسط الحقيقي
من السكان.
سيغما غير معروف. يستخدم المعيار
صيغة CI (باستخدام t) لتحديد النطاق مع
CI ٪ فرصة لاحتواء المتوسط الحقيقي
من السكان.
CI لنسبة. يستخدم المعيار
صيغة CI (باستخدام p ، n ، Z) لتحديد النطاق مع
CI ٪ فرصة لاحتواء المتوسط الحقيقي
من السكان.
المرافق الإحصائية:
التباديل والجمع بين إعطاء عدد
طرق لتحديد العناصر n من العناصر N.
في التباديل ترتيب المسائل المختارة ،
في مجموعات لا. أخذ العينات هو
من دون بديل.
حجم العينة n ، هو العدد المطلوب لـ CI
المعلمات التالية:
alpha - CI بين 0 و 1.0
سيغما - الانحراف المعياري المعروف.
الخطأ المطلوب.
الصيغة هي: n = (Z ^ 2 * s ^ 2) / E ^ 2
Z هي النتيجة Z لـ (1-alpha) / 2
يتضمن 5 اختبارات إحصائية شائعة ،
والاحصاء الوصفي.
يتم تضمين تعليمات لكل اختبار في
التطبيق.
صيغ الإحصاءات الاستنتاجية:
الفرق بين 2 يعني السكان.
اختبار الفرضية يعني.
النسب.
مجانا!. يرجى زيارة هذا التطبيق في
متجر Google Play لتقييم و
أدخل التعليقات. هذا سوف يساعدنا
تحسين التطبيق مع مرور الوقت.
تم اتخاذ العناية الواجبة لنتائج دقيقة.
هذا التطبيق هو للاستخدام التعليمي.
ومع ذلك ، لا warrenty ضد أي أضرار بسبب
يتم تضمين الاستخدام أو ضمني.
Statistical Tables Plus 5.3 - معلومات APK
نُسخة APK: 5.7الحزمة: com.marcusacademy.stattabsplusآخر إصدار من Statistical Tables Plus 5.3
نُسخ أخرى


تطبيقات من الفئة نفسها